Qube Platform Release 2.47: New Tools to Improve Emissions Management
We’re excited to announce Qube Dashboard Release 2.47, which introduces key upgrades to improve your emissions tracking and analysis. This release focuses on enhancing the user experience, streamlining data analysis, and helping you act faster when it matters most.
Enhanced Mobile User Interface
We’ve redesigned our mobile interface to provide a seamless experience across all devices. Whether you're responding to alarms from the field or monitoring emissions data from your desk, the new interface ensures smooth navigation and immediate access to site details.
Key Features:
The interface adapts to all screen sizes, providing a consistent user experience whether in the field or the office.
Alarm emails include direct links that open specific site information instantly, streamlining response time.
How This Helps: This enhancement reduces downtime by giving users instant access to critical information, allowing them to act promptly from anywhere.

Image: Enhanced Mobile User Interface
Interactive Concentration Roses
The new interactive concentration roses provide an intuitive way to identify likely emission sources. By hovering to preview or clicking to lock rose cones in place, you can quickly visualize wind direction and concentration levels over a given period.
Key Feature: Real-time interaction lets users extend rose cones for better visibility and context.
How This Helps: This tool improves source detection and enhances situational awareness, making emissions tracking more intuitive and actionable.

Image: Interactive Concentration Roses
Overview Page Enhancements
We’ve upgraded the Overview page to include enhanced sorting and filtering options. Now, you can adjust the time range (from 24 hours to 90 days) and sort the CH₄ Emissions by Site table by any column to identify key trends and prioritize critical sites.
Key Feature: Flexible time filters and sortable columns provide a more customizable and efficient way to analyze emissions data.
How This Helps: These updates help users save time and make more informed decisions by quickly identifying trends and high-priority sites.
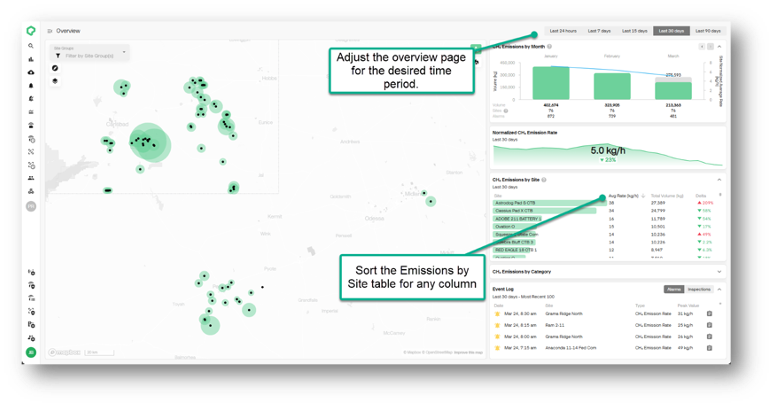
Image: Overview page enhancements
Try It Out Today!
These improvements are designed to give you greater control over emissions management by simplifying complex data and making it easier to respond to critical events. Whether you’re analyzing site-level trends, identifying potential sources, or responding to alarms, Qube’s new features ensure that you can make faster, more informed decisions.
For more insights into how Qube Technologies is driving emissions reduction, explore our expert insights, white papers, case studies or reach out directly.