Leaks Don’t Follow Schedules. Neither Should You.
Respond to emissions when they occur with Qube’s EPA-Approved, Economic Continuous Monitoring Solution
The Solution
Qube’s Continuous, Real-Time Emissions Monitoring Platform
✓ Real-time methane detection at the site level
✓ Physics-guided data modeling to localize and quantify leaks
✓ Continuous compliance tracking to meet federal and state regulations.
✓ Seamless integration with reporting tools.
How It Works
Reliable Sensor Hardware
Accurate Physics-Based Data Modeling
Intuitive Dashboard
Hardware
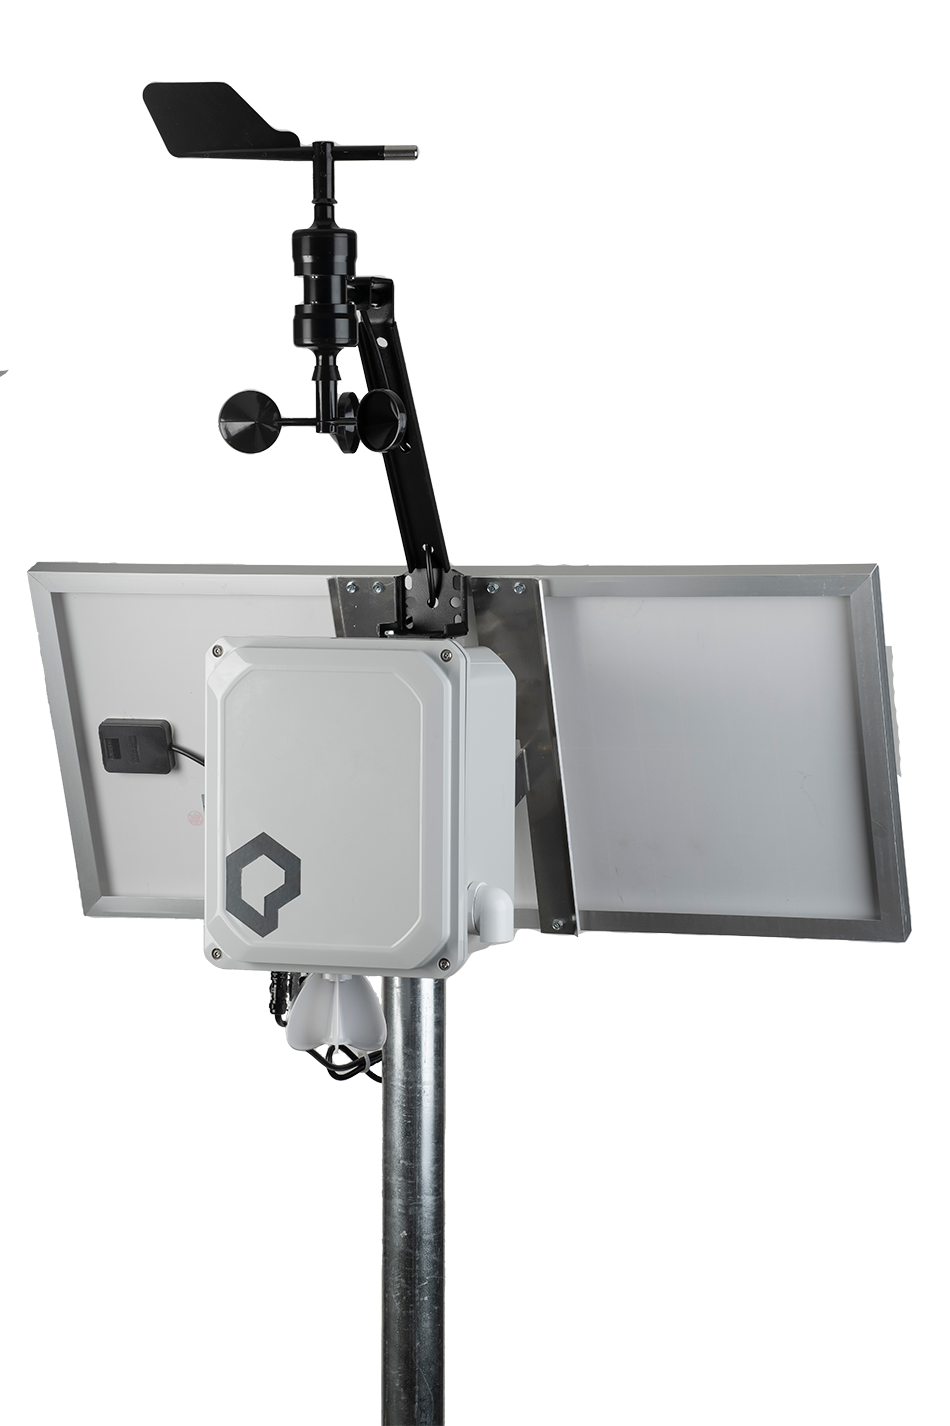
Qube’s Axon device is easy to install. In just 20 minutes, and without an external power source, you can start monitoring gas emissions.

Robust enclosure
Gas sensor array
Edge computing
Rechargeable and long lasting power supply
Communications module
• GPS for precise positioning
Environmental sensors
Data Science
-
Qube's Al-driven detection models analyze real-time gas concentration data.
✓ Baseline filtering removes natural background methane.
✓ Anomaly detection identifies spikes beyond normal levels. -
Using wind modeling and sensor triangulation, Qube determines leak sources.
✓ Wind-field analysis tracks methane plume movement.
✓ Multi-sensor comparison ensures accurate source pinpointing
✓ Filters out offsite emissions (e.g., livestock, wetlands). -
Qube's physics-based models estimate site emission rates.
✓ Gaussian plume models predict plume spread and source strength.
✓ Automated machine learning tuning for continuous model accuracy.
✓ Tracks emissions over time for trend analysis.
Real-Time Dashboard and Reporting
Qube’s intuitive dashboard provides complete visibility into emissions performance.
• Live site emissions map with heatmap visualizations.
• Historical trend analysis to track compliance progress.
• Device uptime tracking to ensure 24/7 monitoring reliability.
• Automated data exporting for regulatory reporting.
• API integrations for seamless data flow.
Release Notes
Case Studies
How are you meeting your methane reduction requirements?
Fill out the form field and we’d love to give you more information about our solutions.


