Qube Dashboard Release 2.46 is Live: Enhanced Emissions Monitoring, Inspection Logging, and Improved Data Export Functionality
What’s New?
Source Level Emissions & Emission Rate Visualization
Take control of your site’s emission data with new visualization capabilities designed to provide a clearer, more detailed view of source level emission rates. These enhancements include:
The new Source View on the CH₄ Rate, which enables a more precise analysis of source-level emission trends through time.
Expanded Emission Bar functionality, allowing users to refine emission tracking to the source level.
How this helps: Greater visibility into source level emissions, supporting more targeted mitigation efforts and improved compliance reporting.
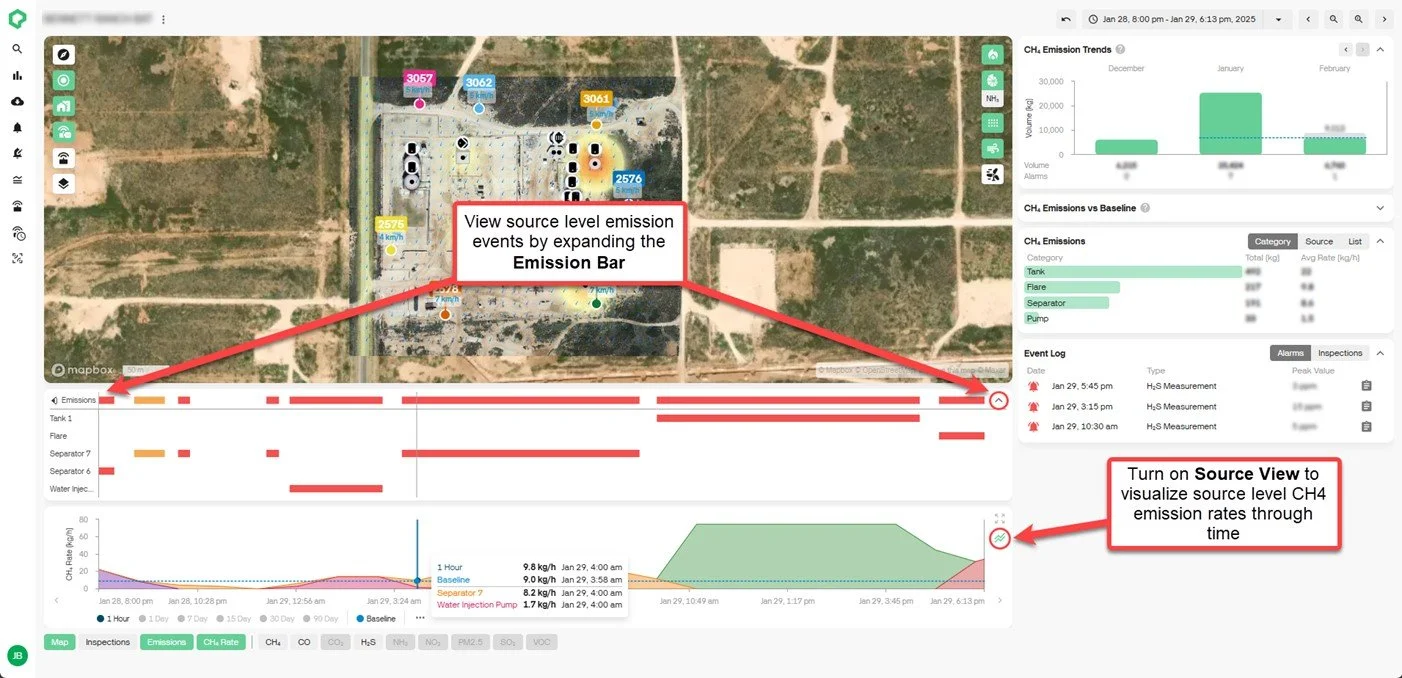
New Source View and Emission Bar visualizations provide clearer emission rates at the source level.
AVO & OGI Inspections
The platform now supports the ability to log and store survey-based inspections directly in the Qube platform with the new Survey Type inspection feature. Users can select from AVO (Audio, Visual, and Olfactory) or OGI (Optical Gas Imaging) inspection types, add inspection findings, and attach PDF, CSV, or image files for streamlined record-keeping and compliance tracking.
How this helps: Simplify regulatory compliance by centralizing all leak detection and repair (LDAR) records in the platform, reducing administrative burden and improving historical data tracking.
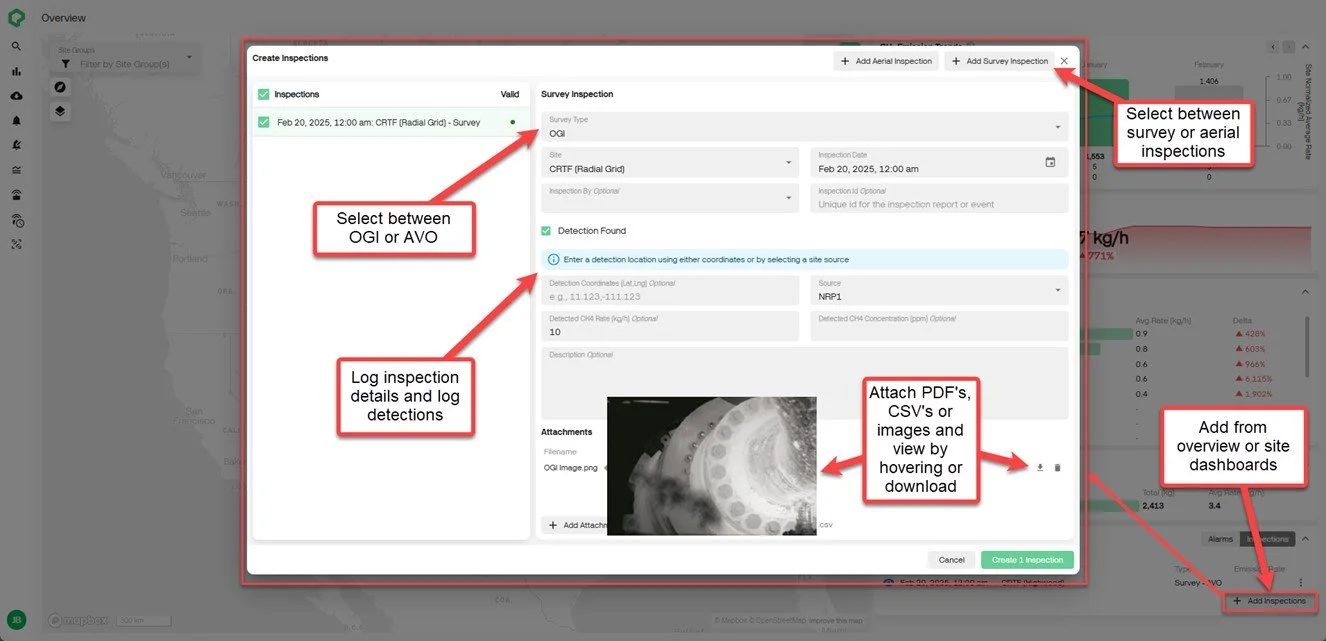
Store survey-based inspections directly in the Qube dashboard.
Average Measurement-Based Alarms
Create measurement level alarms based on average concentration data over time!
When setting your alarm parameter, select “Average” instead of “Max” as the calculation method and define a desired averaging period (sliding window) to trigger alerts based on sustained concentration readings rather than single concentration spikes.
How this helps: Greater flexibility in alarm configuration, tailoring measurement-based alarms to your operational needs.
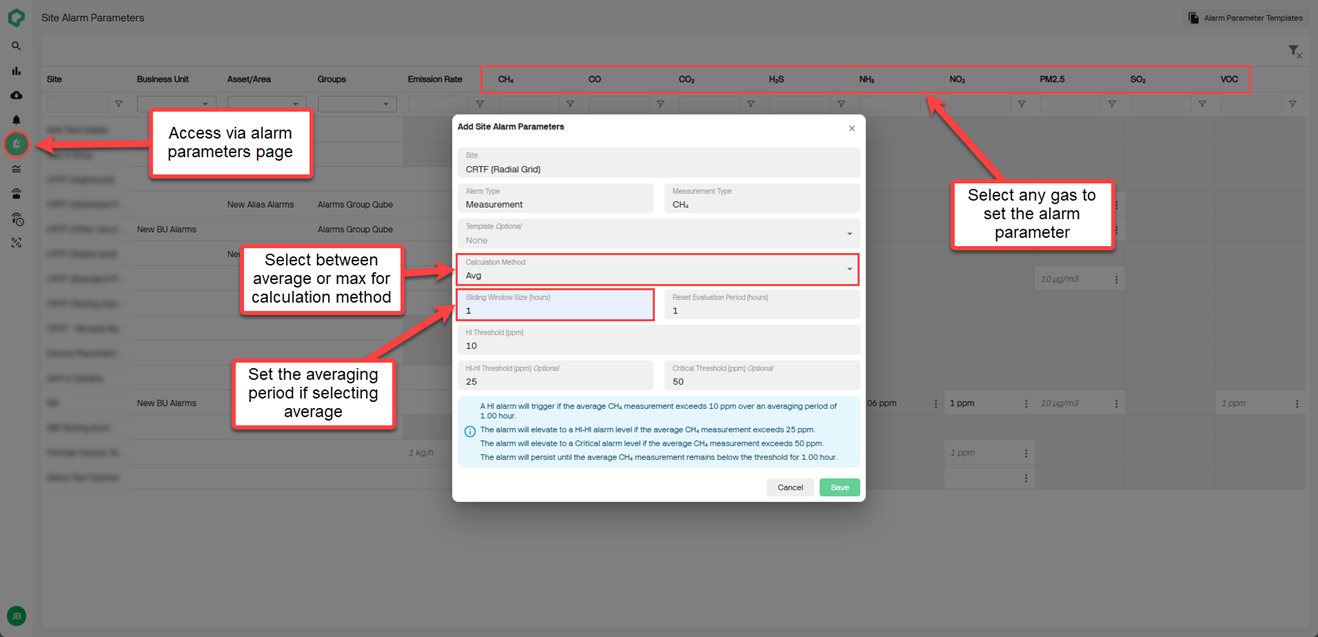
Create measurement level alarms based on average concentration data.
Average Device Data Exports
Export average device data directly from the platform.
By navigating to the “Export Data” page, select “Export Device Data”, select “Average” as the sampling method, and select from a sampling period of 15 minutes, 1 hour or 1 day to generate reports with averaged measurements.
How this helps: Expanded options for data exports, extracting the same averaged data displayed on the platform for offline analysis and integration into your external systems.
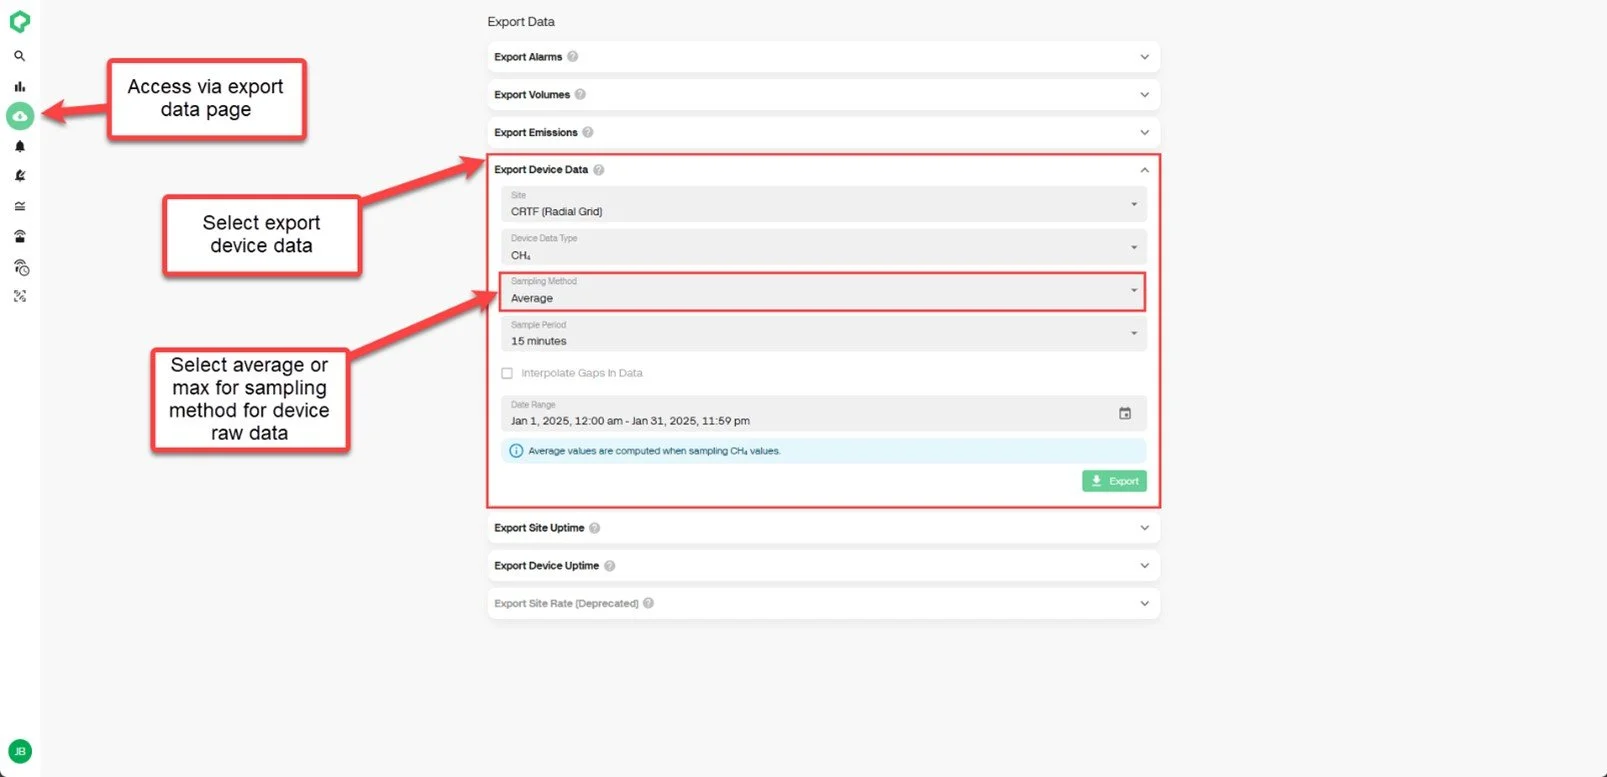
Export averaged data directly from the dashboard.
Try It Out Today!
These updates are now live. Explore these new features and gain deeper insights into your emissions performance.
For more insights into how Qube Technologies is driving emissions reduction, explore our expert insights, white papers, case studies or reach out directly.